TV411

Tune in to Learning

Photosynthesis: Math Lesson: Activity 1 of 3

Prev ActivityNext Activity
DictionaryCalculator

Directions

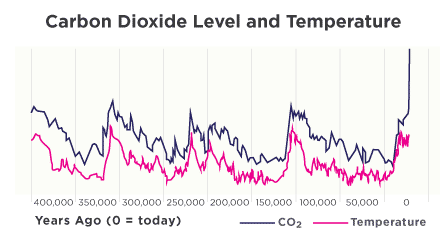
The level of carbon dioxide is closely linked to global temperature. Check out this graph. The dark blue line shows the level of CO₂ in the atmosphere. The pink line shows the temperature. Do the patterns look similar? When 2 sets of data like these share a relationship, we say that the 2 sets of data are correlated.

[+] Click to enlarge the image

High carbon levels are associated with warming of the Earth, while low carbon levels are associated with cooling of the Earth in periods known as ice ages. Look at the graph. How many ice ages do you think there were in the last 400,000 years?
PrevNext
Question 7 of 10